2025-2026
Envizom Dashboard & Analytics
A widget canvas where users build their own dashboards, 1 per city, region or country, instead of accepting a single default.
Product Design
Sustainability
A widget library that builds dashboards, analytics and the map
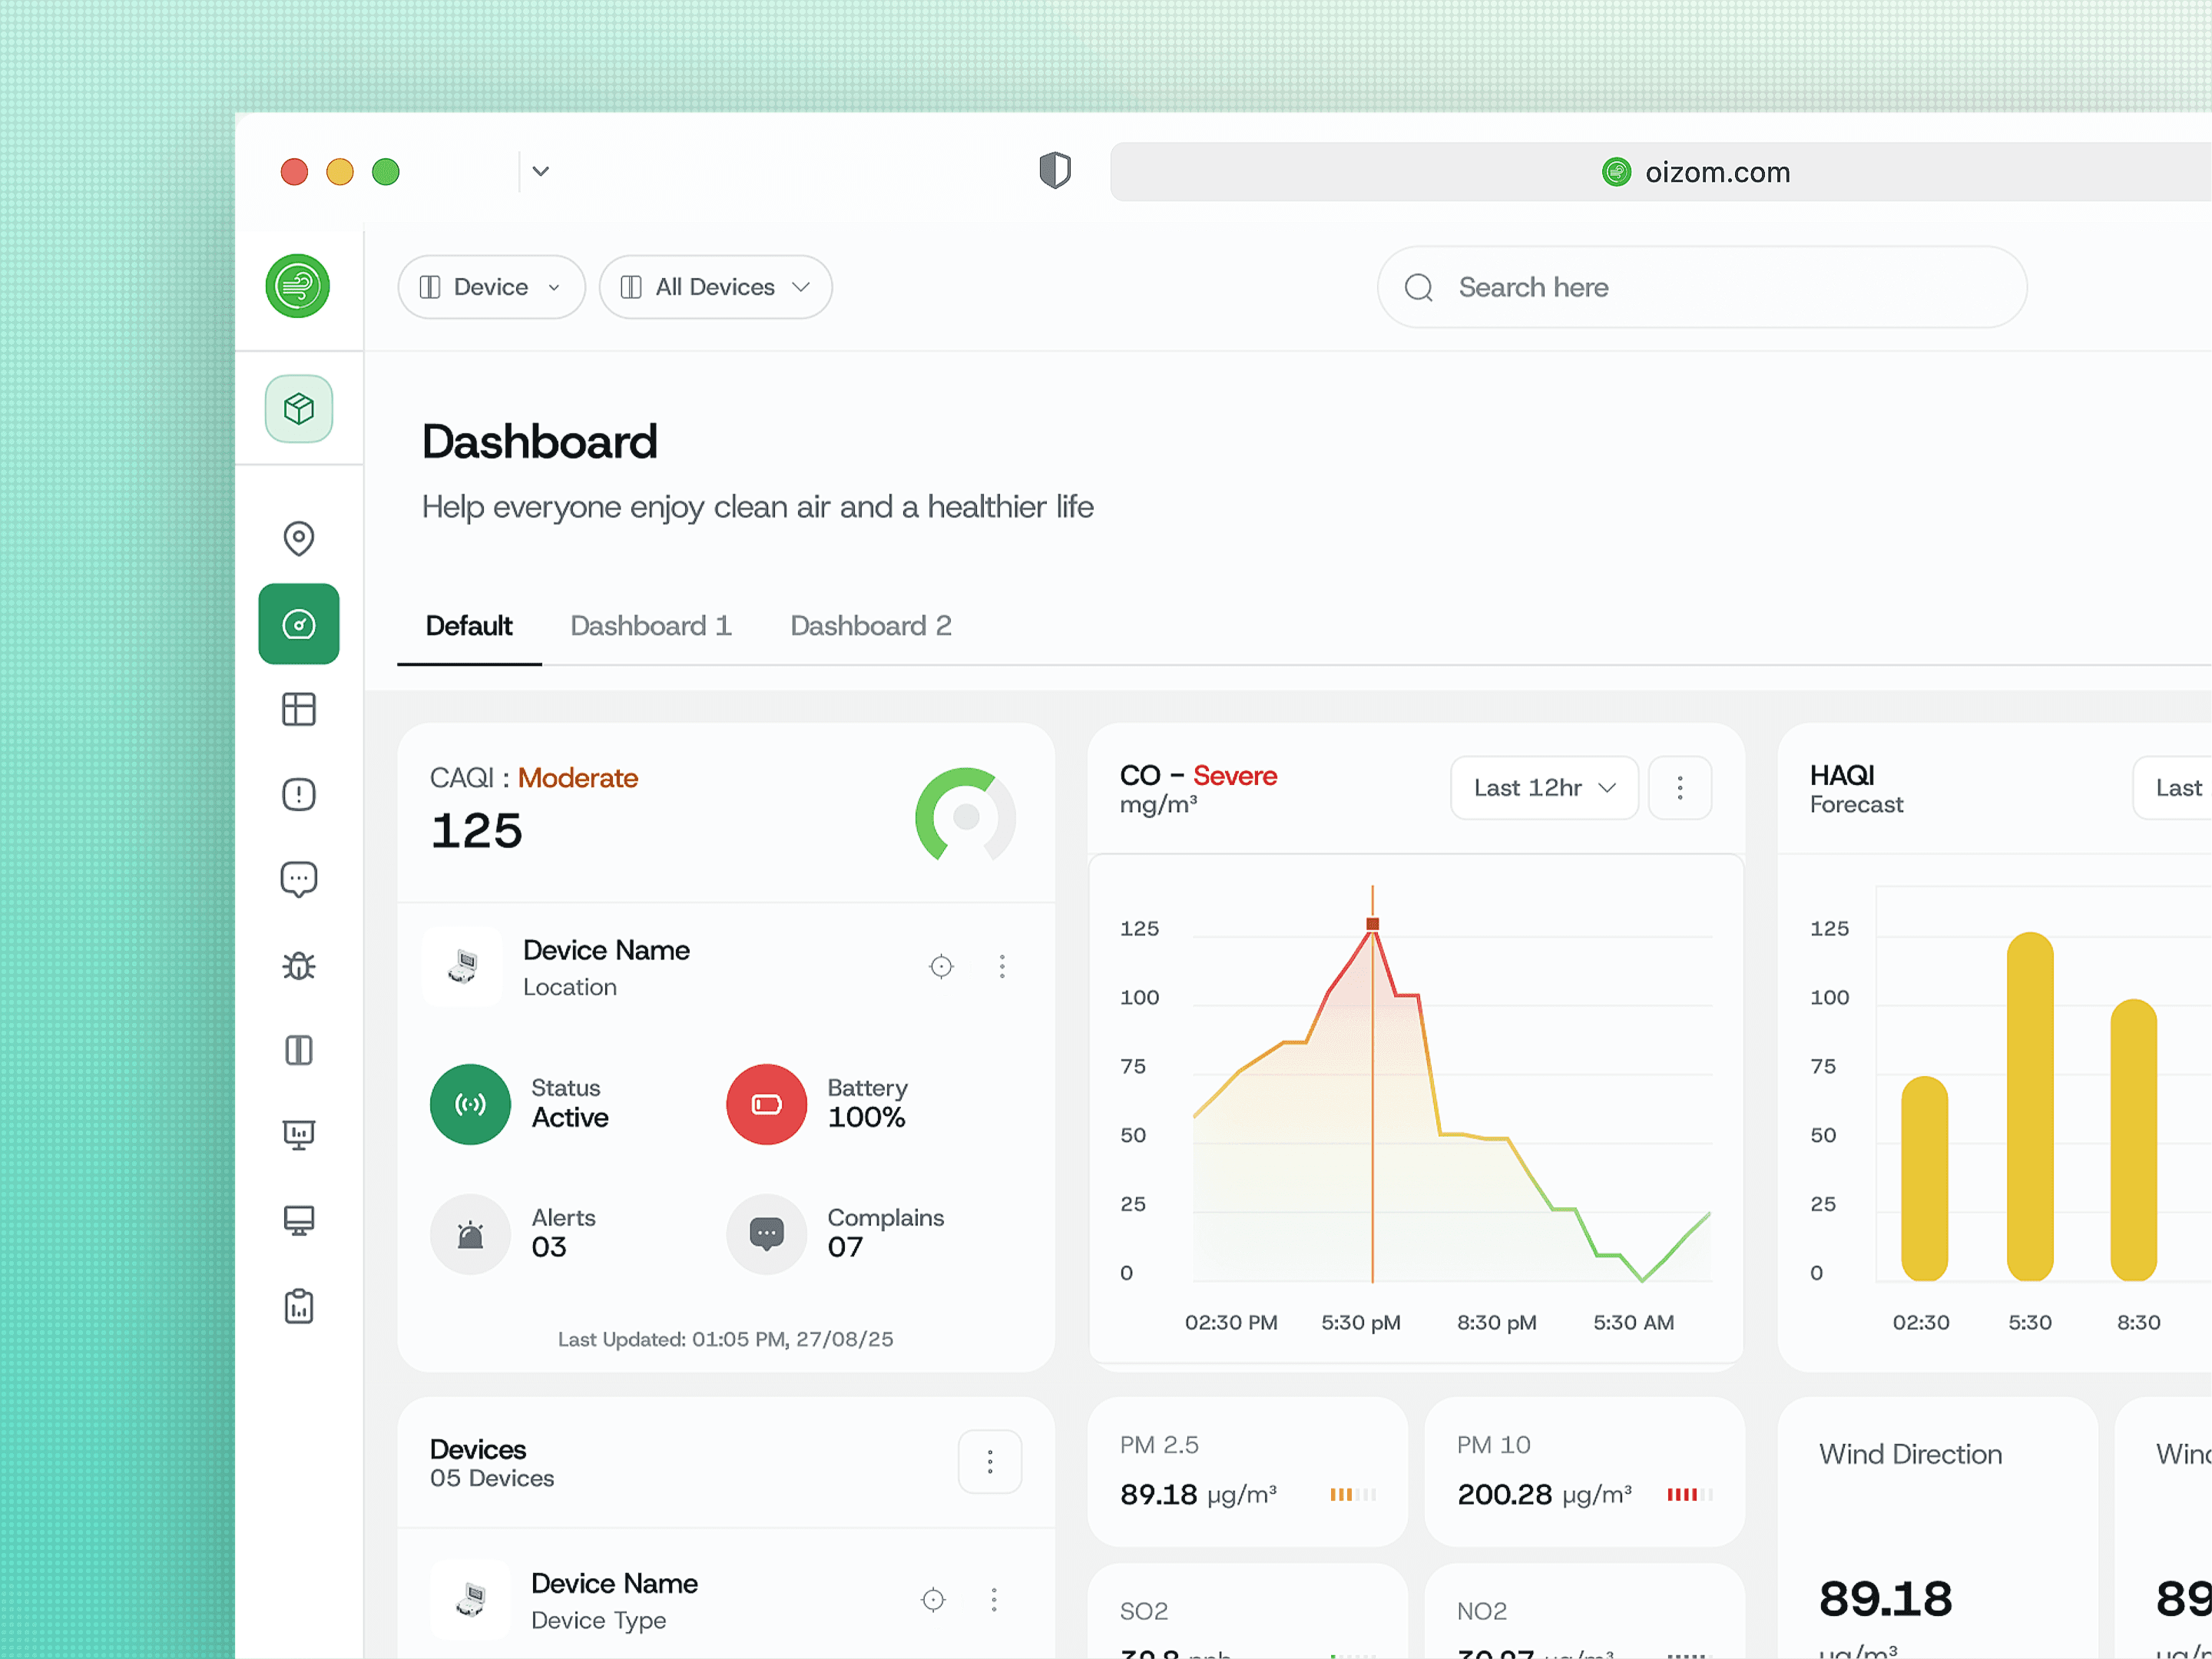
The dashboard is where most Envizom users land. I rebuilt it as a widget-based canvas rather than a fixed layout, with widgets covering numbers, text, lists, device info and a full chart set.
Users create as many dashboards as their organisation needs, one per city, region, country or trade. The same widget library then feeds custom analytics and gets dragged onto the map, so 1 library serves 3 surfaces.
I designed the platform alone, so anything I built once had to work in more than one place.
Service
Branding & Identity
Timeline
6 Weeks
Client
Nova Ventures
Location
Falls Church, VA
No 2 organisations monitoring air quality are shaped the same way. A single fixed dashboard is a guess about a structure the vendor cannot see.
Problem
A default dashboard fits the vendor's idea of the customer, not the customer.
Oizom sells to municipalities, industrial plants, resellers and research teams. A city runs monitoring by ward. A plant runs it by zone. A multinational runs it by country. A fixed default dashboard serves whichever of those the vendor happened to design for and quietly fails the rest.
The readings are also not one kind of thing. Particulate matter, gases, noise and weather all come off the same hardware, and they are read differently. A pollutant wants a band and a threshold. Wind wants direction. Noise wants a range rather than a point. One chart type cannot carry all of that.
And the people reading it sit at 3 different altitudes. A super admin scanning 12 client accounts, a project admin running one deployment, and an end customer who wants to know whether the air outside their building is safe today. The same screen has to answer all 3 without becoming a compromise that serves none of them.
Solution
Do not guess the structure. Give people the parts and let the organisation's own shape emerge.
The dashboard is a canvas, not a layout. Users drag widgets in and arrange them. Multiple dashboards sit as tabs across the top, and I put add buttons interleaved between the tabs rather than only at the end. Dashboard order carries meaning to the person who built it, so the person who built it controls where a new one lands.
Download sits next to the dashboard tabs. That placement is deliberate. It means someone can generate a report straight out of a view they assembled themselves, instead of rebuilding the same selection inside the reports module.
Analytics got a page, and complaints got a modal. Same principle, opposite answers. Analytics configuration is interdependent and needs to be seen whole, so it earns a full page. Raising a complaint should feel light and frequent, so it became a modal. I rejected the instinct to make everything consistent in container type. Container weight should match task weight, not match itself.
Concept
The widget library is the reason 1 designer could ship a platform this wide.
The same widget library appears on 3 surfaces. Dashboards, custom analytics, and the map, where widgets are dragged directly onto the geography so someone can build a monitoring view that is spatial and numeric at once. Nothing was rebuilt for the map. It opened the same panel.
Charts ship in multiple sizes down to the smallest tile, because a widget dropped into a narrow column and a widget filling half a dashboard are the same chart being asked different questions. Designing only the large version is how dashboards end up with unreadable thumbnails.
Custom dashboards carry a numeric limit set in module permissions. Whether a customer gets 5 or 50 is a setting rather than a release. That turns the permission system into a packaging system, and it is the quietest commercial decision in the platform.
Build the parts well enough and the customer assembles a product you never had to design.
More Works
(NK® — 02)
©2024

FAQ
01
What does a project look like?
02
How is the pricing structure?
03
Are all projects fixed scope?
04
What is the ROI?
05
How do we measure success?
06
What do I need to get started?
07
How easy is it to edit for beginners?
08
Do I need to know how to code?
2025-2026
Envizom Dashboard & Analytics
A widget canvas where users build their own dashboards, 1 per city, region or country, instead of accepting a single default.
Product Design
Sustainability
A widget library that builds dashboards, analytics and the map
The dashboard is where most Envizom users land. I rebuilt it as a widget-based canvas rather than a fixed layout, with widgets covering numbers, text, lists, device info and a full chart set.
Users create as many dashboards as their organisation needs, one per city, region, country or trade. The same widget library then feeds custom analytics and gets dragged onto the map, so 1 library serves 3 surfaces.
I designed the platform alone, so anything I built once had to work in more than one place.
Service
Branding & Identity
Timeline
6 Weeks
Client
Nova Ventures
Location
Falls Church, VA
No 2 organisations monitoring air quality are shaped the same way. A single fixed dashboard is a guess about a structure the vendor cannot see.
Problem
A default dashboard fits the vendor's idea of the customer, not the customer.
Oizom sells to municipalities, industrial plants, resellers and research teams. A city runs monitoring by ward. A plant runs it by zone. A multinational runs it by country. A fixed default dashboard serves whichever of those the vendor happened to design for and quietly fails the rest.
The readings are also not one kind of thing. Particulate matter, gases, noise and weather all come off the same hardware, and they are read differently. A pollutant wants a band and a threshold. Wind wants direction. Noise wants a range rather than a point. One chart type cannot carry all of that.
And the people reading it sit at 3 different altitudes. A super admin scanning 12 client accounts, a project admin running one deployment, and an end customer who wants to know whether the air outside their building is safe today. The same screen has to answer all 3 without becoming a compromise that serves none of them.
Solution
Do not guess the structure. Give people the parts and let the organisation's own shape emerge.
The dashboard is a canvas, not a layout. Users drag widgets in and arrange them. Multiple dashboards sit as tabs across the top, and I put add buttons interleaved between the tabs rather than only at the end. Dashboard order carries meaning to the person who built it, so the person who built it controls where a new one lands.
Download sits next to the dashboard tabs. That placement is deliberate. It means someone can generate a report straight out of a view they assembled themselves, instead of rebuilding the same selection inside the reports module.
Analytics got a page, and complaints got a modal. Same principle, opposite answers. Analytics configuration is interdependent and needs to be seen whole, so it earns a full page. Raising a complaint should feel light and frequent, so it became a modal. I rejected the instinct to make everything consistent in container type. Container weight should match task weight, not match itself.
Concept
The widget library is the reason 1 designer could ship a platform this wide.
The same widget library appears on 3 surfaces. Dashboards, custom analytics, and the map, where widgets are dragged directly onto the geography so someone can build a monitoring view that is spatial and numeric at once. Nothing was rebuilt for the map. It opened the same panel.
Charts ship in multiple sizes down to the smallest tile, because a widget dropped into a narrow column and a widget filling half a dashboard are the same chart being asked different questions. Designing only the large version is how dashboards end up with unreadable thumbnails.
Custom dashboards carry a numeric limit set in module permissions. Whether a customer gets 5 or 50 is a setting rather than a release. That turns the permission system into a packaging system, and it is the quietest commercial decision in the platform.
Build the parts well enough and the customer assembles a product you never had to design.
More Works
(NK® — 02)
©2024
FAQ
01
What does a project look like?
02
How is the pricing structure?
03
Are all projects fixed scope?
04
What is the ROI?
05
How do we measure success?
06
What do I need to get started?
07
How easy is it to edit for beginners?
08
Do I need to know how to code?
2025-2026
Envizom Dashboard & Analytics
A widget canvas where users build their own dashboards, 1 per city, region or country, instead of accepting a single default.
Product Design
Sustainability
A widget library that builds dashboards, analytics and the map
The dashboard is where most Envizom users land. I rebuilt it as a widget-based canvas rather than a fixed layout, with widgets covering numbers, text, lists, device info and a full chart set.
Users create as many dashboards as their organisation needs, one per city, region, country or trade. The same widget library then feeds custom analytics and gets dragged onto the map, so 1 library serves 3 surfaces.
I designed the platform alone, so anything I built once had to work in more than one place.
Service
Branding & Identity
Timeline
6 Weeks
Client
Nova Ventures
Location
Falls Church, VA
No 2 organisations monitoring air quality are shaped the same way. A single fixed dashboard is a guess about a structure the vendor cannot see.
Problem
A default dashboard fits the vendor's idea of the customer, not the customer.
Oizom sells to municipalities, industrial plants, resellers and research teams. A city runs monitoring by ward. A plant runs it by zone. A multinational runs it by country. A fixed default dashboard serves whichever of those the vendor happened to design for and quietly fails the rest.
The readings are also not one kind of thing. Particulate matter, gases, noise and weather all come off the same hardware, and they are read differently. A pollutant wants a band and a threshold. Wind wants direction. Noise wants a range rather than a point. One chart type cannot carry all of that.
And the people reading it sit at 3 different altitudes. A super admin scanning 12 client accounts, a project admin running one deployment, and an end customer who wants to know whether the air outside their building is safe today. The same screen has to answer all 3 without becoming a compromise that serves none of them.
Solution
Do not guess the structure. Give people the parts and let the organisation's own shape emerge.
The dashboard is a canvas, not a layout. Users drag widgets in and arrange them. Multiple dashboards sit as tabs across the top, and I put add buttons interleaved between the tabs rather than only at the end. Dashboard order carries meaning to the person who built it, so the person who built it controls where a new one lands.
Download sits next to the dashboard tabs. That placement is deliberate. It means someone can generate a report straight out of a view they assembled themselves, instead of rebuilding the same selection inside the reports module.
Analytics got a page, and complaints got a modal. Same principle, opposite answers. Analytics configuration is interdependent and needs to be seen whole, so it earns a full page. Raising a complaint should feel light and frequent, so it became a modal. I rejected the instinct to make everything consistent in container type. Container weight should match task weight, not match itself.
Concept
The widget library is the reason 1 designer could ship a platform this wide.
The same widget library appears on 3 surfaces. Dashboards, custom analytics, and the map, where widgets are dragged directly onto the geography so someone can build a monitoring view that is spatial and numeric at once. Nothing was rebuilt for the map. It opened the same panel.
Charts ship in multiple sizes down to the smallest tile, because a widget dropped into a narrow column and a widget filling half a dashboard are the same chart being asked different questions. Designing only the large version is how dashboards end up with unreadable thumbnails.
Custom dashboards carry a numeric limit set in module permissions. Whether a customer gets 5 or 50 is a setting rather than a release. That turns the permission system into a packaging system, and it is the quietest commercial decision in the platform.
Build the parts well enough and the customer assembles a product you never had to design.
More Works
©2024
FAQ
What does a project look like?
How is the pricing structure?
Are all projects fixed scope?
What is the ROI?
How do we measure success?
What do I need to get started?
How easy is it to edit for beginners?
Do I need to know how to code?