
2025-2026
Envizom Maps
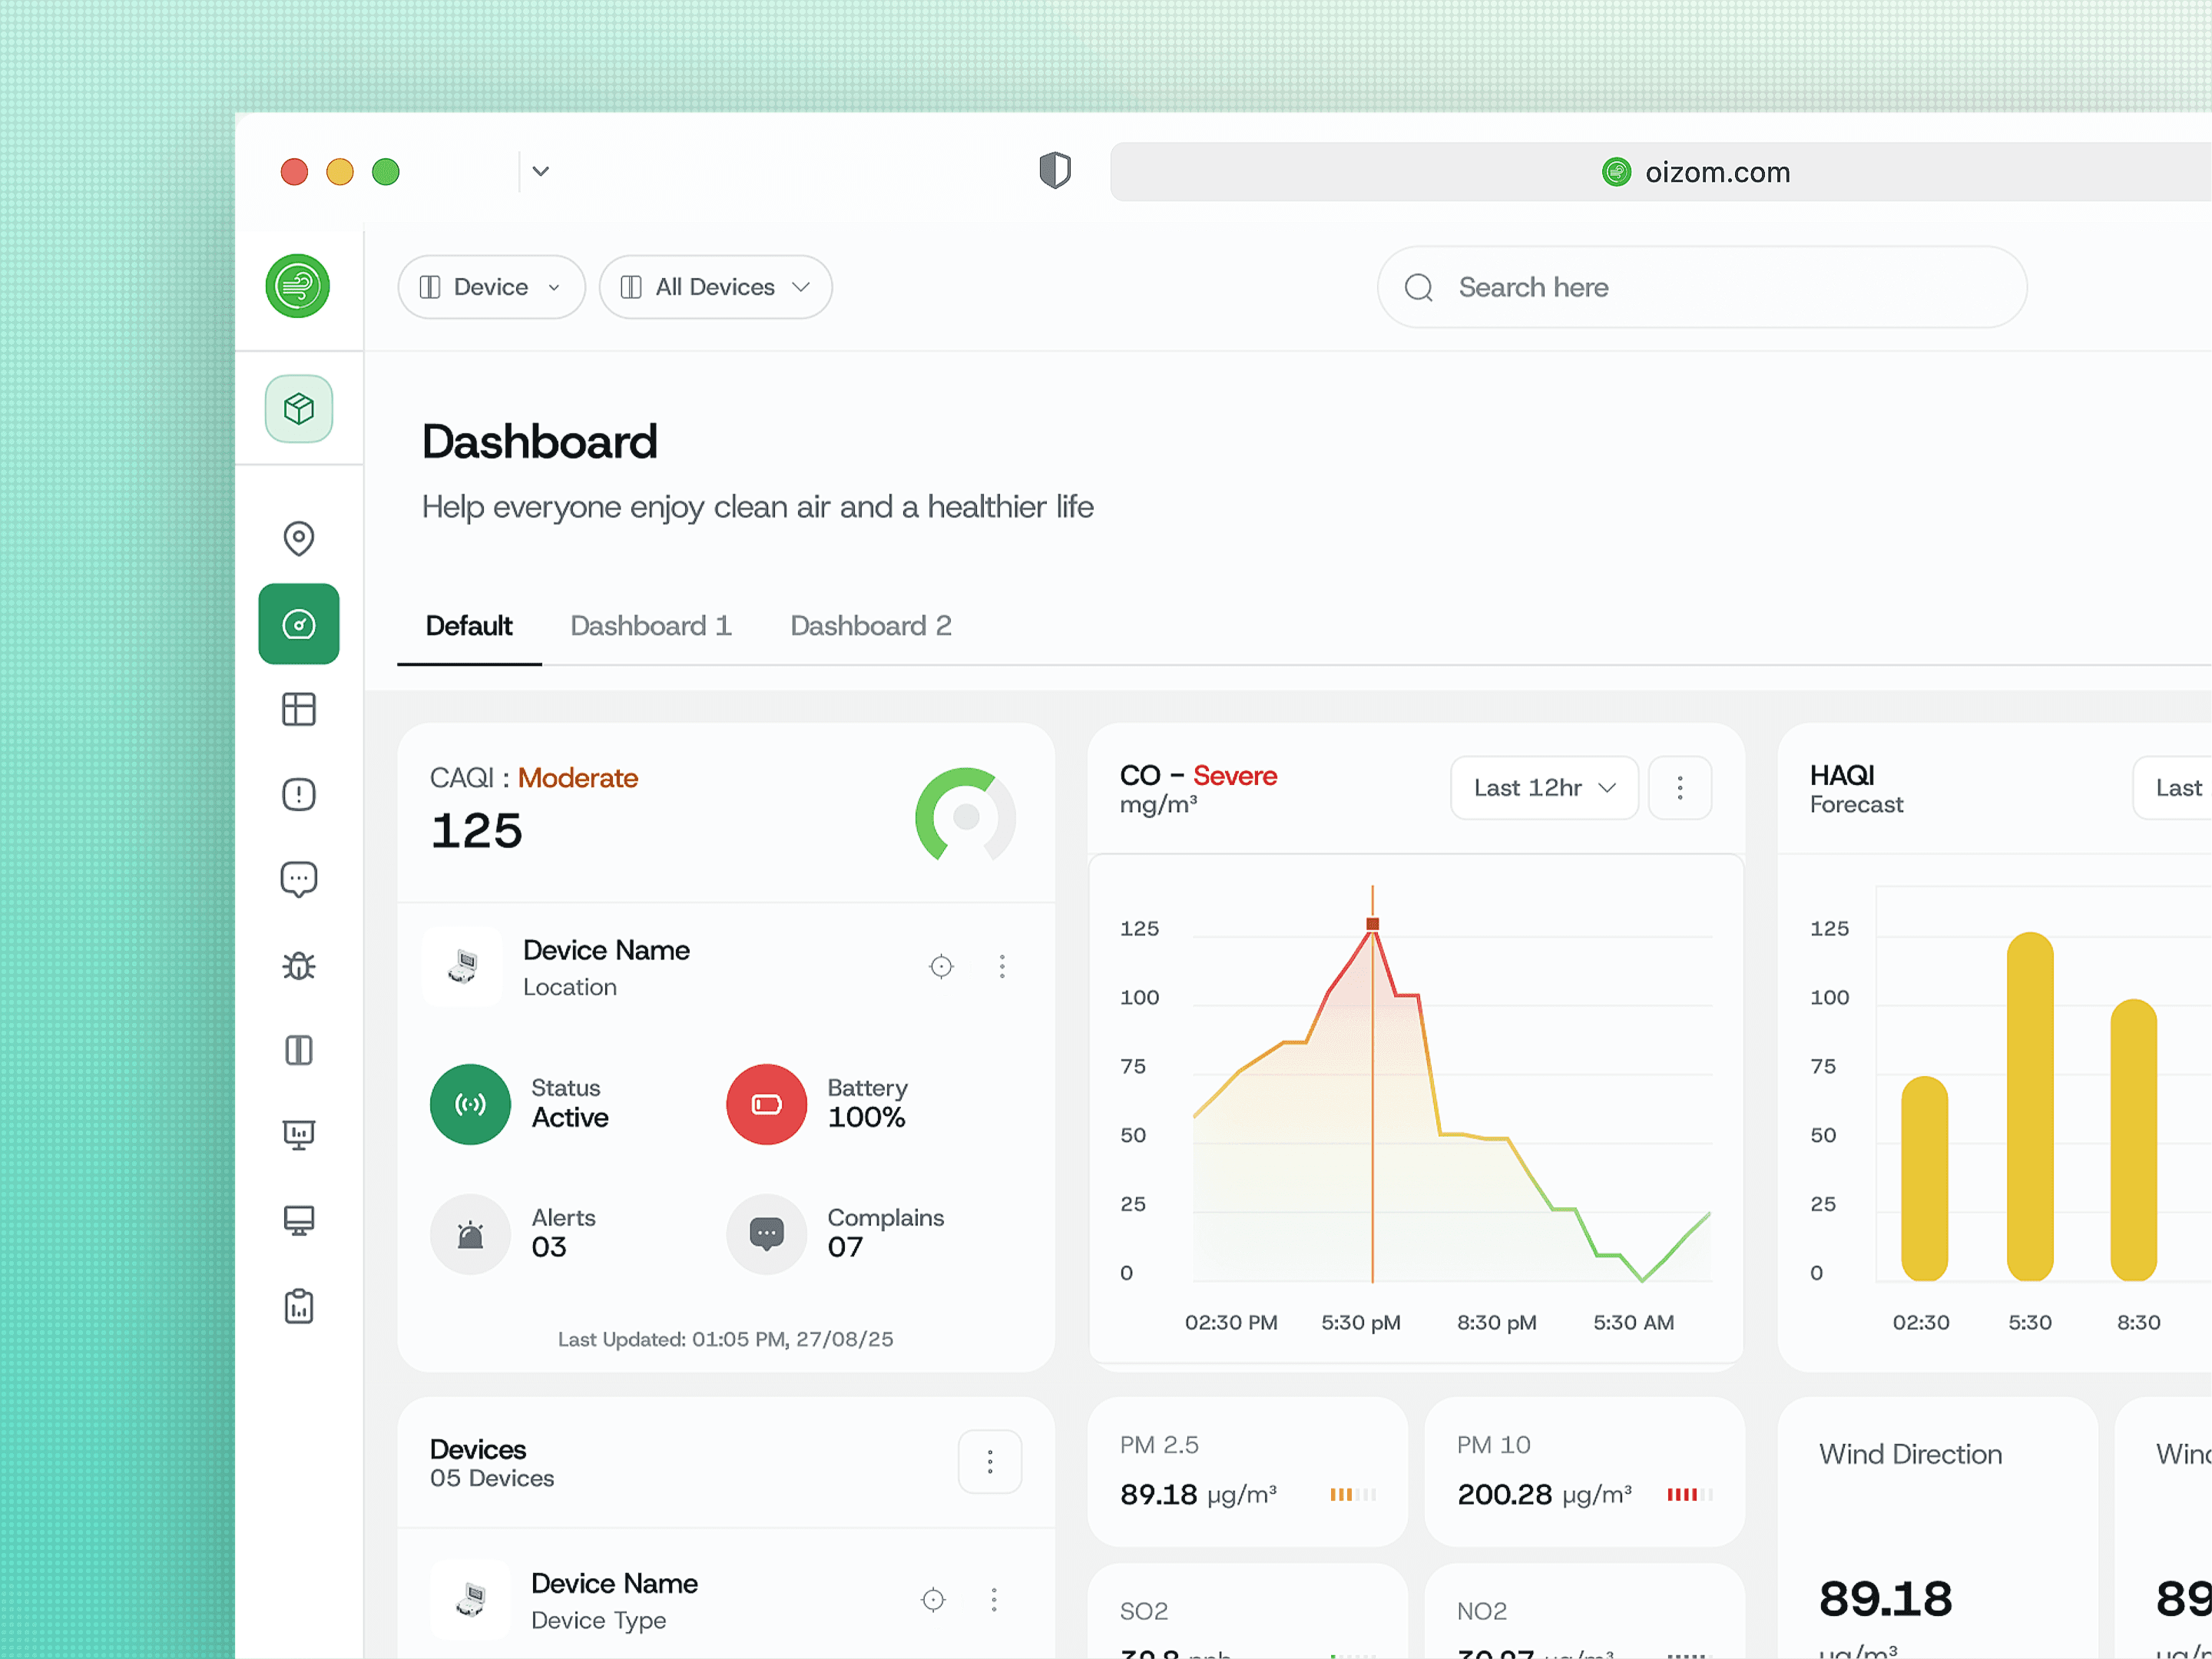
The overview module for Oizom's air quality platform. I turned a pin map into the surface where monitoring, alerts and complaints all happen.
Product Design
Sustainability
3 monitoring modes on one map, built entirely from existing components
Oizom builds air quality monitoring hardware deployed across several countries, and the map is where their users spend the day. I redesigned it as part of a wider platform rebuild, as the only designer on the project.
The module carries 3 modes in one surface: device monitoring, alert monitoring and complaint monitoring, switched from a single control. On top of that sit drawable monitoring clusters, map-native complaint raising, and the same widget library the dashboard uses, dragged onto the map itself.
Almost nothing in it was designed from scratch. That is the part I am proudest of.
Service
Branding & Identity
Timeline
6 Weeks
Client
Nova Ventures
Location
Falls Church, VA
Monitoring is spatial. Air moves through places, devices sit in places, complaints happen in places. Anyone watching a deployment is already watching a map.

Problem
The old map showed devices and nothing else. Everything users actually did happened somewhere else.
Every pin looked the same. A deployment mixes hardware, and the old map drew a generic marker for all of it. Someone looking at 2 readings in the same district could not tell whether a dust monitor or a weather station was reporting, which changes what the number means.
Alerts and complaints were not on the map at all. They lived in tables. But the actual job is rarely reading one alert, it is working out whether a cluster of them means something, and a spatial pattern is invisible in a list.
Raising a complaint meant leaving the map. Monitoring is when you notice a problem. The old flow made you exit the surface where you noticed it, open a different module, and re-establish a location you were already looking at. That is how complaints quietly stop getting raised.
Cluster creation was a small map inside a page form. You drew a region roughly, in a cramped viewport, with no feedback about what you had drawn. Vague by construction.
Solution
Bring the work to the map instead of sending people away from it.
Pins say what they are. I drew a custom icon for each device type across the 6 products, so a glance answers both what the air is doing and which instrument is reporting it. Hover opens a compact card with the CAQI ring, the reading and its band, device name and type, location, connection status and battery.
Alerts and complaints became modes, not destinations. Two controls at the top left switch the whole map between devices, alerts and complaints. Alert pins take their colour from the AQI severity scale. The listing panel opens alongside, grouped Today, Last 03 Days, Last Week, and the prev and next arrows step through alerts one at a time with the map moving to follow. Reviewing a week of alerts across a city now never touches a table.
Complaints are dropped where they are noticed. Enter complaint mode, place a pin, and the map shifts to a pulsing state so there is no doubt you are placing rather than browsing. A panel carries live coordinates with copy actions, a location search for people who prefer typing an address to aiming, and a toggle that hides every other complaint so existing pins do not block the new one. That toggle only exists because I watched someone try to place a pin inside a cluster of pins.
Concept
A monitoring zone is a real area. Drawing one without knowing its size is guessing.
Clusters are drawn on the real map. The entire surface enters a drawing state. Click to place nodes and a live panel reports cursor latitude and longitude, nodes placed, current segment length, estimated area and total perimeter, with undo, redo, a pan tool, and a switch between precise polygon and simple radius modes.
Those live measurements are the point. A monitoring zone usually maps to a ward boundary, a site perimeter or a regulatory catchment. Watching 0.42 km and 188.4 m resolve as the shape forms turns drawing into measuring. On completion, the naming modal pre-selects every device already inside the boundary and lets the user correct from there, because the software knows what is geometrically inside and only the user knows what belongs to the programme.
I refused to give the map its own vocabulary. A hero module invites bespoke treatment, and I turned it down. The info panel, the listing panel, the prev and next stepping, the AQI colour system, the widget library, the smallest chart sizes and the two-step complaint modal are all lifted unchanged from other modules.
That is what a design system is actually for. Not consistent buttons, but the ability to assemble a genuinely different surface out of parts you already have and have it feel native on the first attempt.
More Works
(NK® — 02)
©2024

FAQ
01
What does a project look like?
02
How is the pricing structure?
03
Are all projects fixed scope?
04
What is the ROI?
05
How do we measure success?
06
What do I need to get started?
07
How easy is it to edit for beginners?
08
Do I need to know how to code?
2025-2026
Envizom Maps
The overview module for Oizom's air quality platform. I turned a pin map into the surface where monitoring, alerts and complaints all happen.
Product Design
Sustainability
3 monitoring modes on one map, built entirely from existing components
Oizom builds air quality monitoring hardware deployed across several countries, and the map is where their users spend the day. I redesigned it as part of a wider platform rebuild, as the only designer on the project.
The module carries 3 modes in one surface: device monitoring, alert monitoring and complaint monitoring, switched from a single control. On top of that sit drawable monitoring clusters, map-native complaint raising, and the same widget library the dashboard uses, dragged onto the map itself.
Almost nothing in it was designed from scratch. That is the part I am proudest of.
Service
Branding & Identity
Timeline
6 Weeks
Client
Nova Ventures
Location
Falls Church, VA
Monitoring is spatial. Air moves through places, devices sit in places, complaints happen in places. Anyone watching a deployment is already watching a map.
Problem
The old map showed devices and nothing else. Everything users actually did happened somewhere else.
Every pin looked the same. A deployment mixes hardware, and the old map drew a generic marker for all of it. Someone looking at 2 readings in the same district could not tell whether a dust monitor or a weather station was reporting, which changes what the number means.
Alerts and complaints were not on the map at all. They lived in tables. But the actual job is rarely reading one alert, it is working out whether a cluster of them means something, and a spatial pattern is invisible in a list.
Raising a complaint meant leaving the map. Monitoring is when you notice a problem. The old flow made you exit the surface where you noticed it, open a different module, and re-establish a location you were already looking at. That is how complaints quietly stop getting raised.
Cluster creation was a small map inside a page form. You drew a region roughly, in a cramped viewport, with no feedback about what you had drawn. Vague by construction.
Solution
Bring the work to the map instead of sending people away from it.
Pins say what they are. I drew a custom icon for each device type across the 6 products, so a glance answers both what the air is doing and which instrument is reporting it. Hover opens a compact card with the CAQI ring, the reading and its band, device name and type, location, connection status and battery.
Alerts and complaints became modes, not destinations. Two controls at the top left switch the whole map between devices, alerts and complaints. Alert pins take their colour from the AQI severity scale. The listing panel opens alongside, grouped Today, Last 03 Days, Last Week, and the prev and next arrows step through alerts one at a time with the map moving to follow. Reviewing a week of alerts across a city now never touches a table.
Complaints are dropped where they are noticed. Enter complaint mode, place a pin, and the map shifts to a pulsing state so there is no doubt you are placing rather than browsing. A panel carries live coordinates with copy actions, a location search for people who prefer typing an address to aiming, and a toggle that hides every other complaint so existing pins do not block the new one. That toggle only exists because I watched someone try to place a pin inside a cluster of pins.
Concept
A monitoring zone is a real area. Drawing one without knowing its size is guessing.
Clusters are drawn on the real map. The entire surface enters a drawing state. Click to place nodes and a live panel reports cursor latitude and longitude, nodes placed, current segment length, estimated area and total perimeter, with undo, redo, a pan tool, and a switch between precise polygon and simple radius modes.
Those live measurements are the point. A monitoring zone usually maps to a ward boundary, a site perimeter or a regulatory catchment. Watching 0.42 km and 188.4 m resolve as the shape forms turns drawing into measuring. On completion, the naming modal pre-selects every device already inside the boundary and lets the user correct from there, because the software knows what is geometrically inside and only the user knows what belongs to the programme.
I refused to give the map its own vocabulary. A hero module invites bespoke treatment, and I turned it down. The info panel, the listing panel, the prev and next stepping, the AQI colour system, the widget library, the smallest chart sizes and the two-step complaint modal are all lifted unchanged from other modules.
That is what a design system is actually for. Not consistent buttons, but the ability to assemble a genuinely different surface out of parts you already have and have it feel native on the first attempt.
More Works
(NK® — 02)
©2024
FAQ
01
What does a project look like?
02
How is the pricing structure?
03
Are all projects fixed scope?
04
What is the ROI?
05
How do we measure success?
06
What do I need to get started?
07
How easy is it to edit for beginners?
08
Do I need to know how to code?
2025-2026
Envizom Maps
The overview module for Oizom's air quality platform. I turned a pin map into the surface where monitoring, alerts and complaints all happen.
Product Design
Sustainability
3 monitoring modes on one map, built entirely from existing components
Oizom builds air quality monitoring hardware deployed across several countries, and the map is where their users spend the day. I redesigned it as part of a wider platform rebuild, as the only designer on the project.
The module carries 3 modes in one surface: device monitoring, alert monitoring and complaint monitoring, switched from a single control. On top of that sit drawable monitoring clusters, map-native complaint raising, and the same widget library the dashboard uses, dragged onto the map itself.
Almost nothing in it was designed from scratch. That is the part I am proudest of.
Service
Branding & Identity
Timeline
6 Weeks
Client
Nova Ventures
Location
Falls Church, VA
Monitoring is spatial. Air moves through places, devices sit in places, complaints happen in places. Anyone watching a deployment is already watching a map.
Problem
The old map showed devices and nothing else. Everything users actually did happened somewhere else.
Every pin looked the same. A deployment mixes hardware, and the old map drew a generic marker for all of it. Someone looking at 2 readings in the same district could not tell whether a dust monitor or a weather station was reporting, which changes what the number means.
Alerts and complaints were not on the map at all. They lived in tables. But the actual job is rarely reading one alert, it is working out whether a cluster of them means something, and a spatial pattern is invisible in a list.
Raising a complaint meant leaving the map. Monitoring is when you notice a problem. The old flow made you exit the surface where you noticed it, open a different module, and re-establish a location you were already looking at. That is how complaints quietly stop getting raised.
Cluster creation was a small map inside a page form. You drew a region roughly, in a cramped viewport, with no feedback about what you had drawn. Vague by construction.
Solution
Bring the work to the map instead of sending people away from it.
Pins say what they are. I drew a custom icon for each device type across the 6 products, so a glance answers both what the air is doing and which instrument is reporting it. Hover opens a compact card with the CAQI ring, the reading and its band, device name and type, location, connection status and battery.
Alerts and complaints became modes, not destinations. Two controls at the top left switch the whole map between devices, alerts and complaints. Alert pins take their colour from the AQI severity scale. The listing panel opens alongside, grouped Today, Last 03 Days, Last Week, and the prev and next arrows step through alerts one at a time with the map moving to follow. Reviewing a week of alerts across a city now never touches a table.
Complaints are dropped where they are noticed. Enter complaint mode, place a pin, and the map shifts to a pulsing state so there is no doubt you are placing rather than browsing. A panel carries live coordinates with copy actions, a location search for people who prefer typing an address to aiming, and a toggle that hides every other complaint so existing pins do not block the new one. That toggle only exists because I watched someone try to place a pin inside a cluster of pins.
Concept
A monitoring zone is a real area. Drawing one without knowing its size is guessing.
Clusters are drawn on the real map. The entire surface enters a drawing state. Click to place nodes and a live panel reports cursor latitude and longitude, nodes placed, current segment length, estimated area and total perimeter, with undo, redo, a pan tool, and a switch between precise polygon and simple radius modes.
Those live measurements are the point. A monitoring zone usually maps to a ward boundary, a site perimeter or a regulatory catchment. Watching 0.42 km and 188.4 m resolve as the shape forms turns drawing into measuring. On completion, the naming modal pre-selects every device already inside the boundary and lets the user correct from there, because the software knows what is geometrically inside and only the user knows what belongs to the programme.
I refused to give the map its own vocabulary. A hero module invites bespoke treatment, and I turned it down. The info panel, the listing panel, the prev and next stepping, the AQI colour system, the widget library, the smallest chart sizes and the two-step complaint modal are all lifted unchanged from other modules.
That is what a design system is actually for. Not consistent buttons, but the ability to assemble a genuinely different surface out of parts you already have and have it feel native on the first attempt.
More Works
©2024
FAQ
What does a project look like?
How is the pricing structure?
Are all projects fixed scope?
What is the ROI?
How do we measure success?
What do I need to get started?
How easy is it to edit for beginners?
Do I need to know how to code?